Has your Double Happiness practitioner asked you to start BBT charting for fertility? Well, that’s because this practice gives us a clearer picture of your case and how best to optimize your fertility. Your questions are answered here.
What is Fertility Charting?
Fertility charting involves recording your basal body temperature (BBT) daily along with observations of changes in cervical fluid.
What is BBT?
When resting, your core temperature drops. This low, resting temperature is known as your basal body temperature (BBT) and it can tell us a lot about your fertility.
Why do Fertility Charting?
If you’re trying to get pregnant, the BBT chart along with cervical fluid observations can tell us a lot about your fertility. When looking at a month of charted temperatures, we can confirm if you have ovulated. It also gives us clues as to the health of your follicular and luteal phases and hormone patterns throughout your cycle.
For your Double Happiness practitioner, the fertility chart offers invaluable insight into your unique Chinese Medicine pattern. This will help us tailor our treatments and herbal prescriptions especially to you, greatly increasing our chances of success.
How do I take my BBT?
You should take your temperature right when you wake up, before getting out of bed or doing anything. Drinking water, eating, talking, and scrolling on your phone can all raise your temperature and it will no longer be considered your basal body temperature.
Keep your thermometer on your bedside table for this reason. You should also try to take the reading at the same time every morning. This can be challenging if you wake at different times throughout the week. Just do your best and note the time you took your temperature (apps do this for you). Also, you need to have had at least four hours of sleep for the reading to be accurate.
Taking your BBT orally is fine. Taking it vaginally or rectally are also options, but you need not. Once you’ve taken your temperature, enter it into the app you’re using or on paper.
What else do I need to note, besides my temperature?
The BBT apps allow you to include other daily notes such as when you have sex, the flow of your period, spotting, mood changes, and your cervical fluid. Charting your cervical fluid changes will be an important addition to your BBT. Look for the egg-white type cervical fluid that marks your fertile window.
What is my “fertile window”?
The fertile window, or days of your cycle during which you could conceive, is typically considered the 3 to 5 days leading up to ovulation and the day of ovulation itself, as sperm can live in the female reproductive tract for up to 6 days. Once you know when you tend to ovulate, it’s a good strategy to have intercourse a little before ovulation.
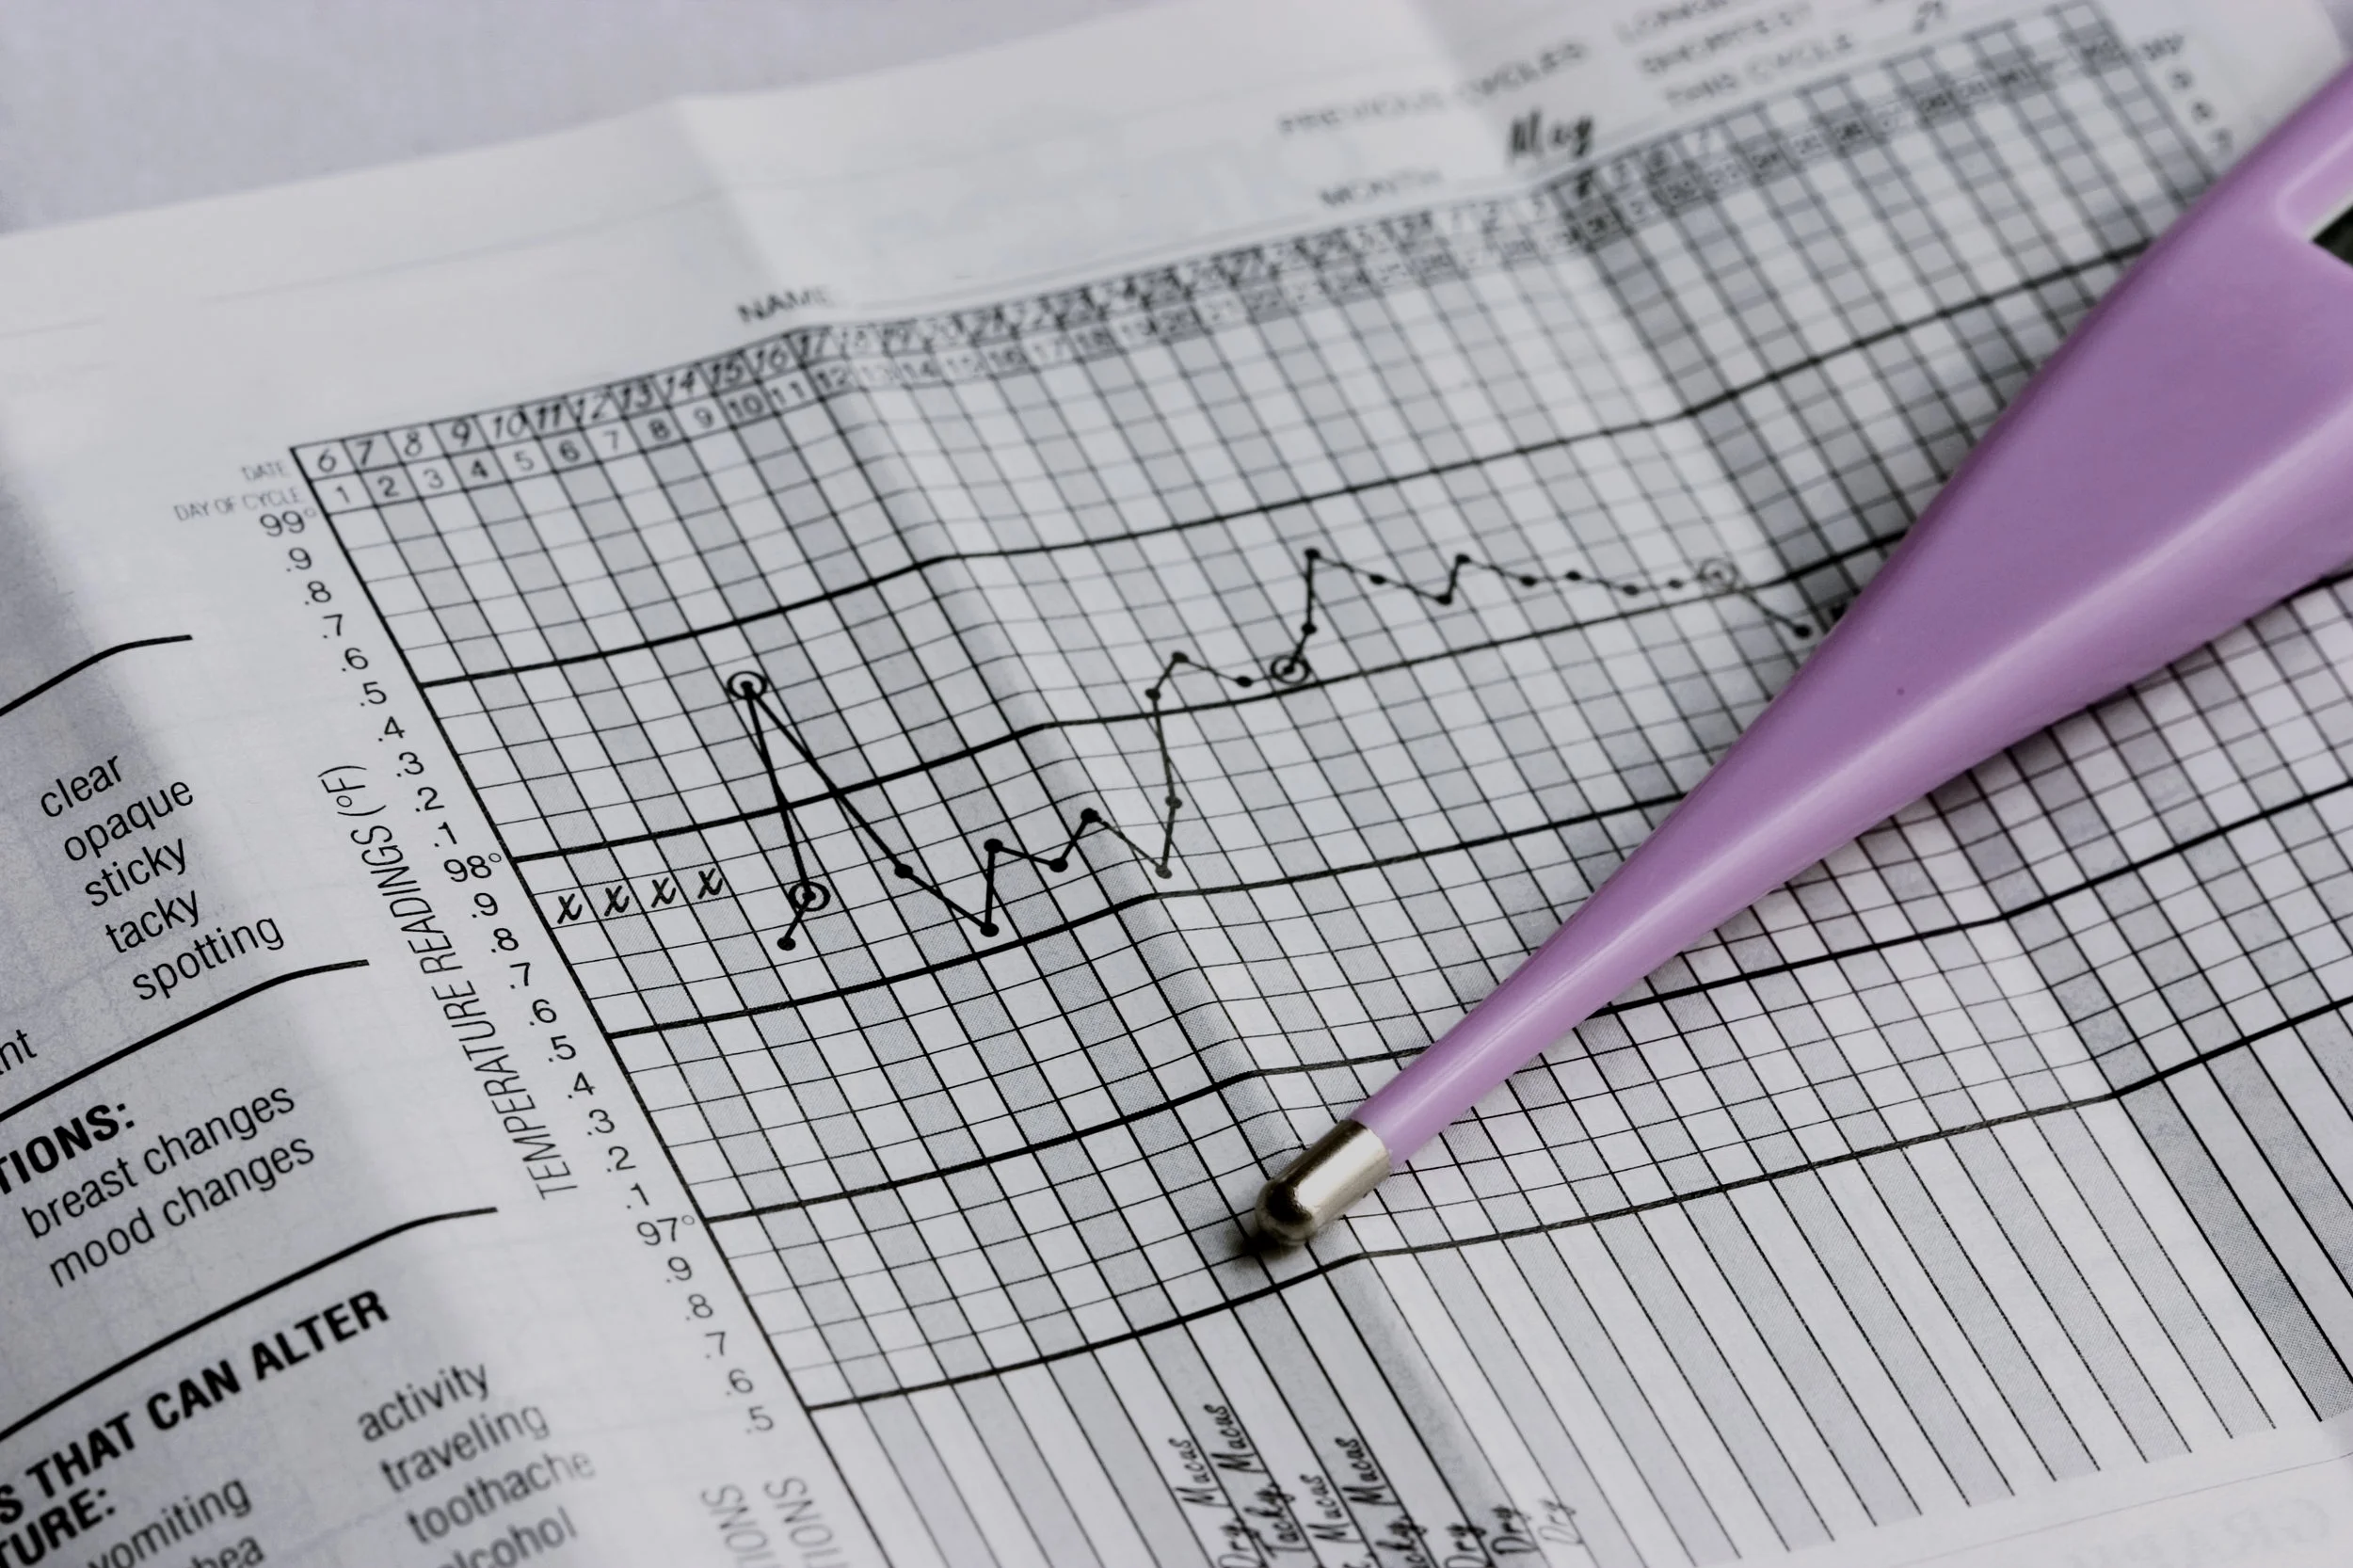
What should my chart look like?
Women with fertile menstrual cycles have a bi-phasic BBT pattern, meaning that the chart has two phases. During the first half of your cycle (follicular phase) which starts the first day of your period, your temperatures will be lower. During the second half (luteal phase) which starts with ovulation, your temperatures will rise 0.5-1.0°F. Ideally, your chart will have two clear phases with the temperature rise happening just after ovulation. We also like to see that two phases are each approximately 14 days long. Some women have a dip in temperature just before ovulation and the rise in temperature, but this is not the case for all.
Will my temperature indicate when I’m about to ovulate?
BBT charting doesn’t predict your ovulation or fertile window, but rather offers a retrospective look at your cycle that, when recorded over time, can tell you which day you usually ovulate. If you are able to chart several cycles using a BBT charting app and your cycle is regular, the app can help predict your fertile window and ovulation.
Ovulation Predictor Kits (OPK) are urine test strips which measure LH (luteinizing hormone) levels in the body to predict ovulation. A positive on the test indicates that you will ovulate in the next 12-36 hours. This can serve as another helpful tool in your fertility toolbox, but doesn’t give the same information to your Chinese medicine practitioner as the BBT chart does. If you use OPKs, start testing your urine on Day 9.
Shouldn’t my temp be 98.6°F?
Great question! Our core temperature is lower when we first wake up after resting all night. Have you ever noticed that you feel cooler after resting on the acupuncture table for a session? For ovulating women, our BBT is lower during the follicular phase, usually ranging from 97.0 to 97.6°F. During the luteal phase, the BBT rises to between 97.7 and 98.3°F. This rise is due to the increase in progesterone (think pro-gestation) which is secreted by the corpus luteum after ovulation. It’s the body’s way of keeping that bun that may be in the oven warm.
If you’re not pregnant, the BBT will drop at the end of the luteal phase, as progesterone production declines. This drop indicates the end of the cycle and the beginning of the next follicular phase. Noticing the drop in temperature provides a good indicator that you will get your period that day.
If your temperature averages 97.6°F or lower, you should have your thyroid levels checked.
What will happen with my temperature if I get pregnant?
If you are pregnant, your temperatures should remain as high as they were during the luteal phase or rise even higher.
My chart looks like a jagged mountain range. What’s up?
If your temperatures vary greatly with lots of peaks and valleys, we call this a “sawtooth pattern”. You may see your temperature spike or dip with sleeping in late, traveling across time zones, alcohol consumption, stress, sleep disturbance, fever, and taking antipyretics (tylenol, aspirin, ibuprofen), so it’s good to document these events. If your chart is consistently erratic, it can indicate Heart and Liver Qi Instability, perhaps with some Heart or Liver Fire, according to Chinese Medicine.
What app should I use?
At DHH, we recommend Fertility Friend or Kindara. If you prefer low-tech methods, you can print out your own BBT charts.
Do I need a special thermometer?
You can find special BBT thermometers which provide precise readings out to two decimal points. If you want to make the process even easier, you can use a bluetooth thermometer that syncs your temperatures and the time to an app (although I can’t vouch for their app).
How long do I have to chart for?
If you can chart for at least 1-2 months, recording your temperatures every day possible, that data will be very useful to inform your Chinese Medicine practitioner. If you’re on a roll and you want to follow your progress as you are treated at DHH, by all means, keep charting!
Resources:
The Fertility Friend and Kindara websites offer great information and trouble-shooting advice:
For more information about basal body temperature and signs of your fertility, see this classic book:
References:
Assessment of menstrual health status and evolution through mobile apps for fertility awareness https://www.ncbi.nlm.nih.gov/pmc/articles/PMC6635432/#CR2
Basal Body Temperature 101 https://www.kindara.com/blog/basal-body-temperature-101
Detection of Ovulation, a Review of Currently Available Methods
https://www.ncbi.nlm.nih.gov/pmc/articles/PMC5689497/
Effectiveness of Fertility Awareness–Based Methods for Pregnancy Prevention: A Systematic Review
Modern fertility awareness methods: wrist wearables capture the changes in temperature associated with the menstrual cycle
https://www.ncbi.nlm.nih.gov/pmc/articles/PMC6265623/